
Corner kick volume in professional football is rarely an accidental byproduct of match action; it is a direct consequence of specific tactical structures, wing utilization strategies, and defensive clearance behaviors. During the 2010/11 La Liga season, distinct playing styles across the league created severe disparities in corner creation and concession rates. While casual bettors often make the mistake of associating overall team quality or goal-scoring power directly with high corner counts, historical data demonstrates that team structure dictates corner totals far more reliably than final scorelines. Evaluating which Spanish sides presented high-value opportunities in Over or Under corner lines requires examining tactical delivery methods, pitch width usage, and game-state dynamics.
The Tactical Foundation of Corner Generation in Spanish Football
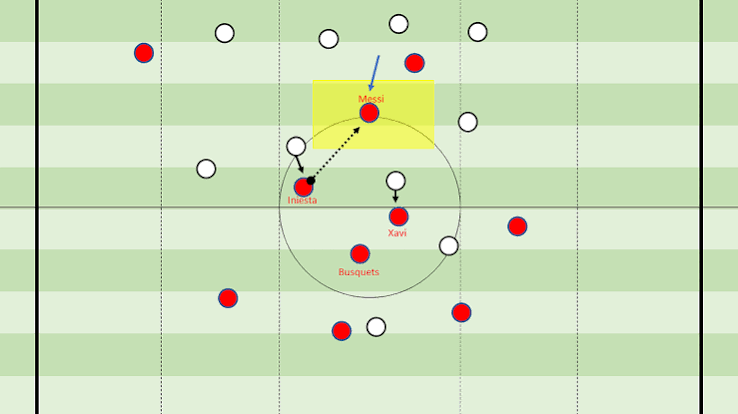
The relationship between possession style and corner generation in La Liga’s 2010/11 campaign was structurally inverted depending on how teams attacked the final third. Barcelona, despite recording historical possession figures, frequently recorded low corner tallies because Pep Guardiola’s system relied on central combination play and short passes inside the penalty box rather than floating crosses from the goal line. Conversely, teams operating with traditional, natural wingers who repeatedly drove to the dead-line to deliver high crosses generated significantly higher corner numbers due to defensive deflections, block attempts, and forced goalkeeper parries.
Understanding these mechanics allows analysts to separate overall team strength from corner productivity. A dominant team that continuously recycles ball possession through the central midfield channels will systematically draw fewer corners than a direct, mid-table side whose primary offensive outlet involves high-volume crossing into a target striker. Identifying these functional distinctions forms the prerequisite for projecting whether a fixture will lean toward Over or Under corner thresholds.
Structural Drivers Behind High-Volume Corner Profiling
Teams that consistently push match corner counts Over set lines exhibit specific tactical signatures that force defensive interventions behind the goal line. In the 2010/11 campaign, sides like Real Madrid under José Mourinho utilized rapid, wide transitions that exploited space behind advancing fullbacks, creating frequent one-on-one isolations near the penalty area boundary.
When analyzing the operational elements that consistently drive corner totals upward, three recurring tactical behaviors become apparent across various match setups.
- High Cross Frequency from Overlapping Fullbacks: Squads that instruct fullbacks to make overlapping runs to the endline force opposition defenders into sliding blocks, directly deflecting the ball out for corner kicks.
- Direct Long-Range Shooting Volume: Teams featuring midfielders who take frequent long-distance shots generate a steady volume of corners via deflected shots and goalkeeper tipped saves over the crossbar.
- Low-Block Defensive Panic Clearances: Outmatched lower-tier teams defending deep in their own box under relentless pressure often choose to clear balls unconditionally over their own goal line rather than risk misdirected central clearances.
When these three factors intersect within a single match, the baseline probability for a high total corner yield increases dramatically. Recognizing these tactical habits allows for accurate pre-match identification of fixture setups ripe for Over corner selections.
Comparative Tactical Profiles and Corner Output Expectations
To build an actionable framework for corner markets, teams from the 2010/11 La Liga season can be categorized based on their primary attacking mechanics and corresponding defensive reactions. Comparing these operational frameworks clarifies why certain high-profile clubs failed to hit Over lines while seemingly average sides generated corner overloads.
The table below breaks down the structural differences in how various tactical approaches directly impact corner creation and concession patterns.
| Team Profile Type (2010/11 Era) | Primary Attacking Channel | Defensive Reaction Forced | Typical Corner Line Tendency |
| Central Tiki-Taka (e.g., Barcelona) | Short central passes through penalty arc | Tight central block, low blocking on flanks | Strongly favors Under total corners |
| Direct Transition / Wide Counters (e.g., Real Madrid) | Rapid wing progression to the dead-line | Frantic wide blocks, forced corner deflections | Strongly favors Over total corners |
| Target-Man Aerial Heavy (e.g., Athletic Bilbao) | Early deep crosses into the 6-yard box | High aerial dual clearances over endline | Lean Over on home fixtures |
| Passive Defensive Low-Block (e.g., Sporting Gijón) | Minimal offensive push, deep central clearance | Unconditional side and rear clearances | High conceded corners, total depends on opponent |
Analyzing this structural distribution proves that total match corners depend entirely on how wide spaces are defended. High corner yields require a team capable of reaching the endline paired with a defense willing to concede endline deflections rather than central passing lanes.
Why Central Possession Systems Naturalize Low Corner Outcomes
It remains a common misconception that total team dominance translates into high corner counts, a fallacy exposed repeatedly by Barcelona’s 2010/11 campaign. Their methodical build-up play aimed to walk the ball into the net through intricate passing triangles, actively avoiding high, lofted crosses from wide areas that typically yield corner deflections. Opponents defending against this style compressed their defensive lines centrally inside the eighteen-yard box, rarely needing to make sliding tackles out wide that push the ball behind the goal line.
Tactical Scenarios Limiting Corner Production
Specific game-plan designs systematically suppress corner totals, creating predictable conditions for Under betting strategies.
Short Corner Routines and Possession Retention
Teams that deliberately choose to take short corners to preserve ball control rather than crossing into a crowded box drastically reduce the secondary corner sequences that typically inflate total match counts.
Midfield Stagnation in Low-Stakes Fixtures
When two mid-table teams with limited wide threat play out a low-intensity match, the ball remains trapped in the central third, resulting in minimal endline actions and extremely low overall corner metrics.
Recognizing when an elite team’s dominance suppresses wide play rather than expanding it provides a crucial edge when evaluating Under market valuations.
Game-State Volatility and In-Play Corner Triggers
Pre-match tactical profiles establish a baseline, but live game-state shifts ultimately dictate whether total corners soar past projections or stall completely. The most violent spikes in corner generation occur when a heavy favorite surrenders an early goal or remains unexpectedly tied against a resolute low-block defense late into the second half.
Observing how live tactical adjustments alter corner rates requires tracking real-time match momentum through a dynamic ufabet168. When a trailing team substitutes on extra wide attackers and switches to a desperate high-crossing strategy during the final thirty minutes of play, live corner lines often trail the actual pitch intensity. Real-time shifts in trailing status transform standard possession teams into high-volume crossing machines, causing corner rates per minute to escalate rapidly.
Tactical Mismatches That Invalidate Pre-Match Corner Projections
While team statistics provide historical baseline metrics, specific head-to-head tactical interactions can completely neutralize a team’s typical corner tendencies. For example, if a team that relies heavily on wide crossing meets an opponent with exceptionally mobile fullbacks capable of stopping crosses before the endline, the projected corner volume for that fixture collapses.
Furthermore, pitch dimensions and weather conditions across different Spanish venues in 2010/11 played an understated role in corner variance. Narrow pitches compressed wide spaces, making it easier for fullbacks to block crosses cleanly into throw-ins rather than conceding corners, whereas rain-slicked surfaces increased goalkeeper spills and erratic defensive clearances behind the line. Ignoring these tactical and environmental friction points leads directly to flawed corner projections.
Systemic Market Mispricing in Corner Totals
Bookmakers frequently establish corner total lines using simplistic algorithms tied to overall team goal totals and historical league averages. This creates structural pricing flaws, as goal expectations do not correlate linearly with corner expectations across contrasting tactical styles.
An analyst examining line variances across a versatile sports betting service will often find that total corner lines for possession-heavy teams are set artificially high due to public perception of their dominance. Identifying fixtures where an offensive power plays a style that avoids dead-line crossing allows disciplined bettors to capitalize on overinflated lines by systematically backing Under outcomes.
Summary
Analyzing corner kick markets from La Liga’s 2010/11 season demonstrates that total corner outcomes are fundamentally driven by tactical style rather than overall team strength or goal-scoring ability. Teams utilizing direct wide transitions, overlapping fullbacks, and high crossing volumes consistently generated conditions favorable for Over corner totals, whereas central possession-oriented sides systematically produced low corner yields that favored Under lines. Accurate corner prediction requires evaluating how defensive structures react to wide pressure, accounting for game-state urgency, and identifying market mispricings where bookmakers fail to distinguish between central dominance and endline attack frequency.